
Exceptional amid disadvantage: what Ofsted’s new grades reveal about the structural divide
At the beginning of this academic year, Ofsted published its new education inspection framework, with inspections beginning in November 2025. The new framework is already telling a more complicated story than a single headline grade ever could. The early data does not show a simple regional failure, or a simple school improvement league table. It shows schools being judged against ‘one-size-fits-all’ standards while operating in very different conditions — different levels of deprivation, different levels of specialist capacity, and very different access to the ‘experts at hand’ who can help schools improve. Under the framework, the evaluation areas are:
● safeguarding
● inclusion
● curriculum and teaching
● achievement
● attendance and behaviour
● personal development and wellbeing
● early years (where applicable)
● post-16 provision (where applicable) and
● leadership and governance
Single headline judgements have been removed and replaced by those 9 evaluation areas, depending on the setting. While safeguarding is evaluated on a met/not met scale, the other areas have a 5-point scale: exceptional, strong standard, expected standard, needs attention, and urgent improvement.
As we reach the end of the academic year, we can begin to assess the patterns emerging in how grades are being awarded. The important point for Schools North East is that these grades must be read in context. Equal standards do not mean equal conditions. That is the heart of the ‘structural divide’ argument we are making in our lobbying work: schools in the North East are often doing the same, or more complex, work with less surrounding capacity than schools in areas with denser services, deeper labour markets, stronger transport links, and more readily available specialist support.
Recent research and reports have highlighted the impact of these structural divides on education, particularly for the North East. Last week, the Independent Inquiry into White Working Class Educational Outcomes published its findings, that disadvantaged white British pupils experience some of the weakest educational outcomes in the country across all stages of education.
The Sutton Trust’s recent Crossing Paths research highlighted wide disparities in attainment and earnings across socio-economic background, ethnicity, gender and region, and found that opportunities for white working class pupils vary significantly depending on where they grow up. And the Young people and work: interim report, published in May, says that ‘the geography of where young people are most likely to be NEET maps onto the geography of labour market weakness with an almost perfect symmetry.’
Regional comparison
In Ofsted’s most recent publication for school inspections and outcomes, covering the period from November 2025 to the end of May 2026, 1,360 schools across the country have been inspected, with almost 10,000 grades awarded across the evaluation areas. The chart below shows the percentage of each grade, across all evaluation areas, awarded in England, London, and the North East.
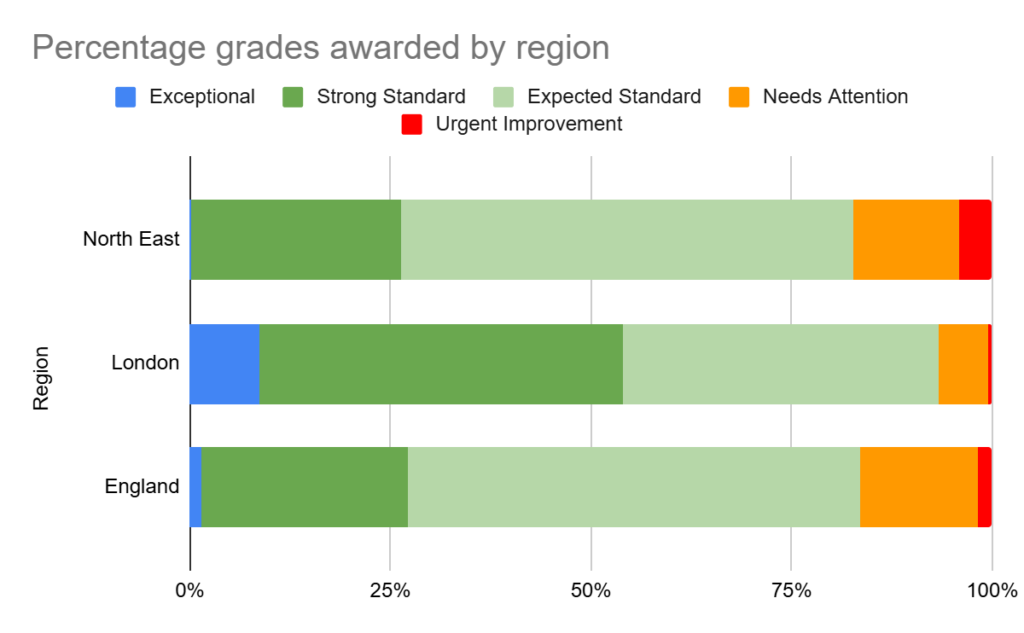
The regional picture is revealing. Schools in London are significantly more likely to be awarded the top grades, with over half of grades awarded in London being either ‘Exceptional’ (9%) or ‘Strong Standard’ (45%). The North East has slightly fewer higher grades and slightly more lower grades than the national average, but the gap with the national picture is marginal. Over 80% of grades awarded in our region were ‘Expected Standard’ or above. The sharper contrast is with London — and that is not simply a story about school quality. It reflects the wider infrastructure around schools. London, and some other large metropolitan areas, have a higher concentration of national organisations, trusts, specialist services, universities, cultural partners, improvement networks, professional advisers, and private market support. In short, there are more experts at hand. The North East has outstanding leaders and schools, but it does not have the same density of support sitting around them.
Grades by stage
In the same dataset, 983 primary schools and 298 secondary schools have been inspected in England. As the chart below shows, secondary schools are slightly more likely to receive ‘Exceptional’ or ‘Strong Standard’, but also more likely to receive ‘Needs Attention’ or ‘Urgent Improvement’. Overall, 84% of primary schools have been awarded ‘Expected Standard’ or above, compared with 81% at secondary.
At present, too few secondary schools in the North East have been inspected for a meaningful comparison within our region. The same is true for special and alternative provision nationally. This matters, because the settings most affected by SEND complexity, attendance pressures, behaviour, safeguarding need and family poverty are often the settings where a simple national comparison tells us least about the actual level of challenge schools are managing.
Disadvantage and the structural divide
Ofsted groups all schools into an IDACI quintile. The deprivation score for each postcode is based on the Income Deprivation Affecting Children Index (IDACI) 2019. The deprivation of a provider also uses data on schools and pupils from the January 2025 school census to calculate the mean of the deprivation indices associated with the home postcodes of the pupils attending the school, rather than the location of the school itself. Schools are then divided into five equal groups, from ‘most deprived’ (quintile 5) to ‘least deprived’ (quintile 1).
The chart below shows how grades are awarded by IDACI quintiles.
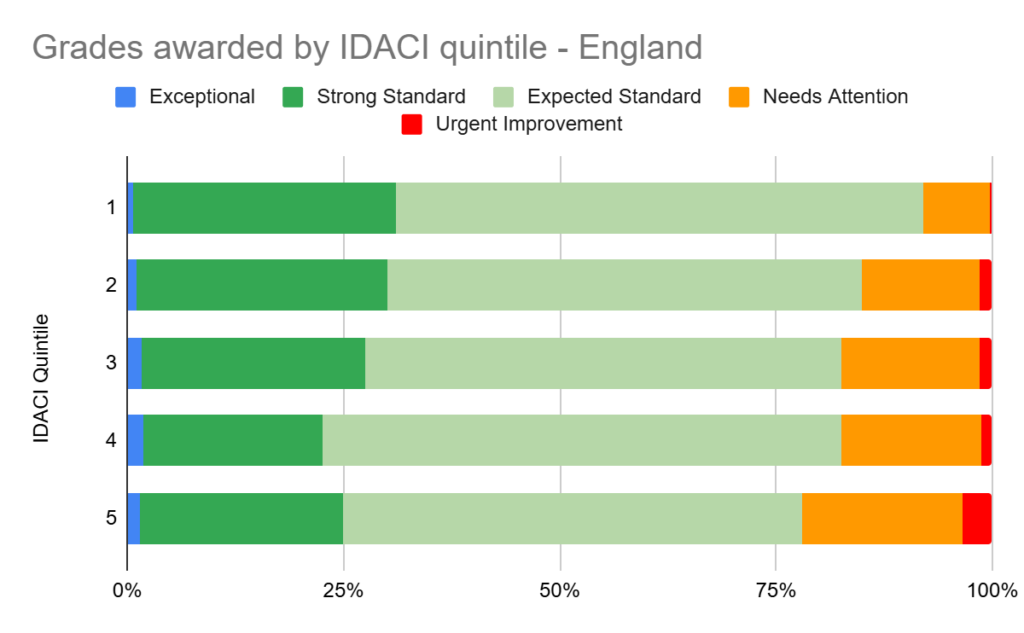
This is where the national data starts to expose the structural divide more clearly. Schools in the most deprived areas are more likely to be awarded the lowest grades. In the quintile with the lowest levels of deprivation, over 90% of schools achieved ‘Expected Standard’ or above, compared with 78% for schools in the areas of highest deprivation. But the story is not one of lower ambition or weaker schools in disadvantaged communities. Schools in more deprived areas are also more likely to receive the top ‘Exceptional’ grade, with quintiles 4 and 5 both outperforming quintiles 1 and 2.
That combination matters. It suggests that schools serving more disadvantaged communities are working in a higher-risk, higher-pressure environment, but that exceptional practice is also present in those communities. This is precisely why Schools North East argues that national policy must look beyond averages. Inspection outcomes cannot be separated from the conditions in which schools operate: poverty, health need, SEND demand, workforce supply, transport, family support, and the availability of trusted external expertise.
Too few schools have been inspected in the North East to compare by IDACI quintiles, but we can compare by rates of free school meals (FSM). As of 9 July 2026, 107 state-funded schools in the North East have a published inspection report under the new framework. The chart below divides these schools into two groups by rates of FSM and shows how grades have been awarded to those groups.
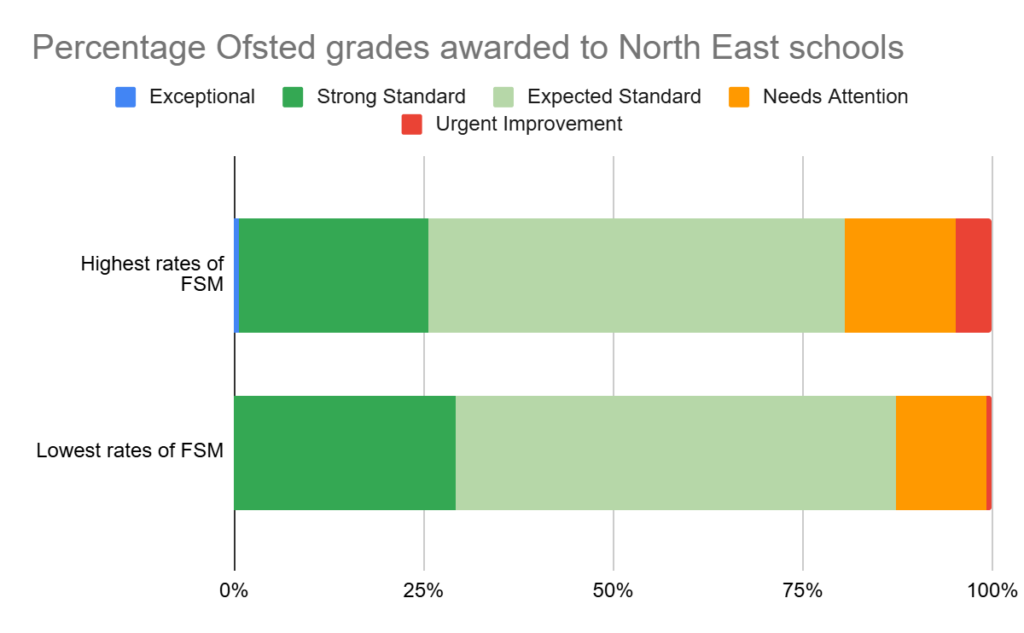
The North East trend is similar to the national IDACI pattern. Schools with higher rates of disadvantage, measured by the percentage of FSM students, receive a higher percentage of ‘Urgent Improvement’ and ‘Needs Attention’. But the most striking detail is that the ‘Exceptional’ grades awarded in the North East have both gone to schools serving areas with higher rates of disadvantage.
It is also important to interpret the FSM comparison carefully. Many of the schools in the lower-FSM group still have FSM rates above the national average, and within this dataset a handful have rates above the North East average. At the national level, more schools have been inspected in areas of high deprivation than in areas of lower deprivation. The data is still early. It should not be overclaimed. But it is already pointing to a pattern that policymakers should not ignore: deprivation changes the job schools are being asked to do, and regional infrastructure changes the support they can draw on to do it.
Exceptional amid disadvantage
So far this academic year, two North East schools have achieved an ‘Exceptional’ grade. St Bede’s Catholic Academy in Stockton, part of the Bishop Hogarth Catholic Education Trust, achieved an ‘Exceptional’ grade for attendance and behaviour in November. More recently, Westgate Hill Primary Academy in Newcastle, part of the Laidlaw Schools Trust, was awarded an ‘Exceptional’ grade for inclusion.
Head Teachers Karl Ellerbrook and Nick Watson said: “We are incredibly proud to receive this recognition for Inclusion. At Westgate Hill Primary Academy, we believe every member of our community deserves to feel seen, supported and inspired to achieve their very best. Our Academy community is wonderfully diverse and we see that as one of our greatest strengths. This judgement reflects the dedication of our staff, pupils, families and wider community who work together every day to create an environment where everyone can flourish.”
Their words capture the wider point. The North East is not asking for lowered expectations or special pleading. We are asking for national policy to recognise that equal standards require equalised conditions. When schools in our region achieve ‘Strong Standard’ or ‘Exceptional’ grades amid higher levels of disadvantage and thinner access to surrounding expertise, that should be recognised as system resilience — and it should strengthen the case for a national approach that closes the structural divide rather than simply measuring its consequences.
Chris Zarraga, Director of Schools North East, said: ‘These results demonstrate the exceptional work taking place in North East schools, often in communities facing the greatest challenges. Our schools are not asking for lower expectations, but for policymakers to recognise that equal standards must be matched by fairer conditions, stronger infrastructure, and access to the right support needed to succeed. Closing this structural divide would allow even more of our region’s children and young people to thrive.’