New figures show impact of disadvantage and ethnicity on Progress 8
Detailed figures showing differential KS4 outcomes by disadvantage and ethnicity were published by the DfE this week.
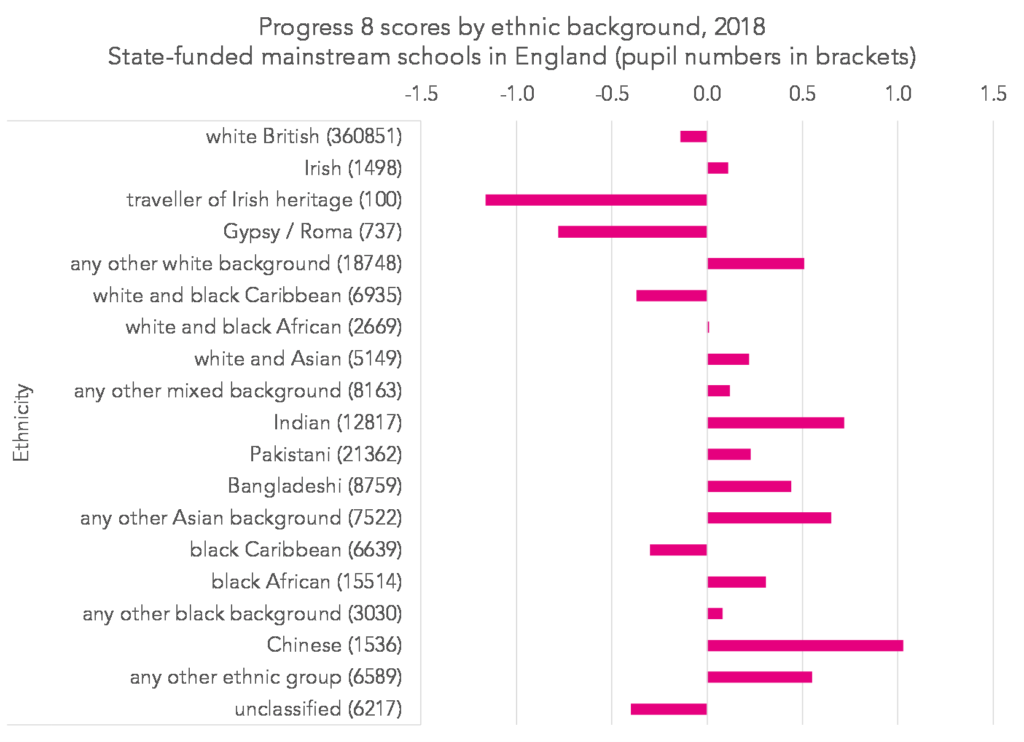
Non-white pupils in the North East achieved significantly better Progress 8 results than white pupils. However, this group makes up a very small proportion (6%) of all pupils in the region, compared to the England average of 20% and the very low numbers in some categories make the results difficult to rely on.
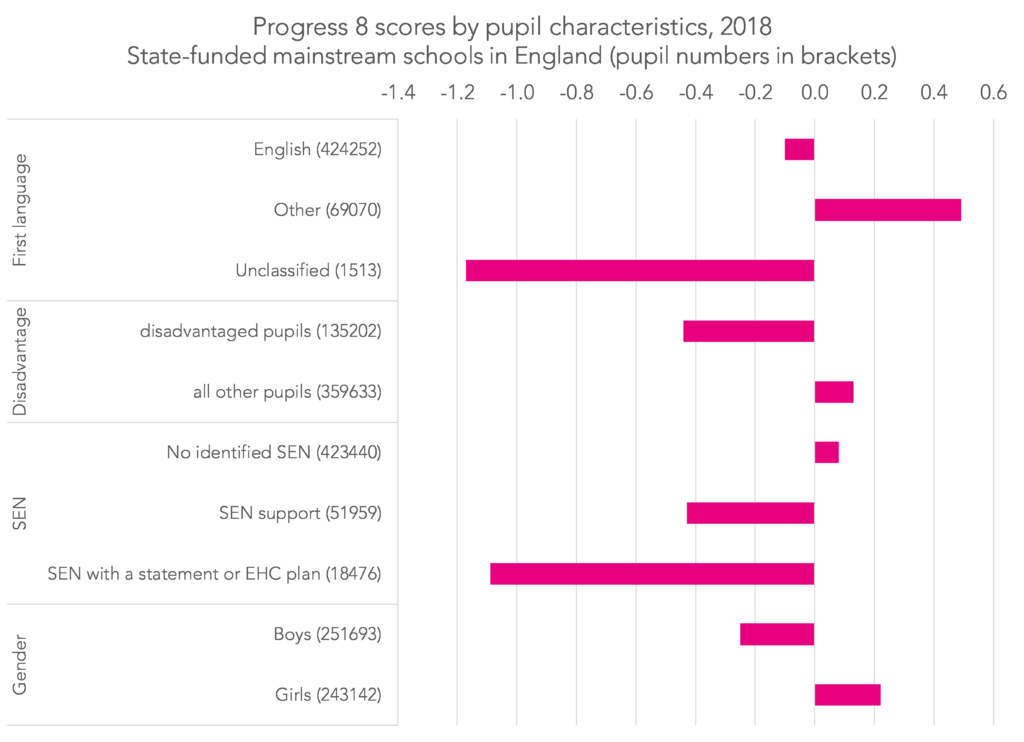
The 4% of North East pupils with English as an Additional Language achieved a Progress 8 score of 0.6, compared to an average of -0.3 for children who have English as their first language.
As shown in the table below, disadvantaged pupils (defined as being eligible for free school meals at any point in the last 6 years) achieved lower progress scores across all areas, though the degree of gap varied by area. Professor Becky Allen has pointed out, however, that this may say more about the demographics of non-pupil premium populations than it does about the promotion of equality in education.
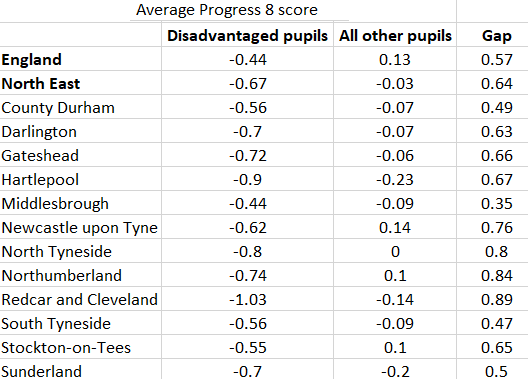
Disadvantaged pupils in London achieved a significantly better (-0.05) average score than England as a whole (-0.44). However, this is thought to be a consequence of the much higher proportion of non-white pupils and the apparently lower impact of disadvantage on the educational outcomes of these groups.
National tables are more detailed and showed similar stratification of Progress scores by ethnicity, disadvantage and SEN status.
Source: FFT Education DataLab, Key Stage 4 performance tables 2018: Four key points from this year’s data
The full figures are available here.